UNIUYO CSC MATLAB PRACTICAL 5 QUESTIONS
Given that the population, P of a city was 0,000 in 2005, but changes at the rate, R by 15% every year
- write a Matlab script to simulate the change in population for the period of six years using the formula C= P(1-(n/100))^n. where C is the current population and n is the year. plot a graph to illustrate the change, and provide a sketch of it.
- Interpret your result
UNIUYO CSC MATLAB PRACTICAL 5 SOLUTIONS
The Code
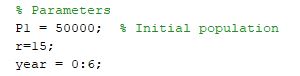
% Parameters
P1 = 50000; % Initial population
r=15;
year = 0:6;
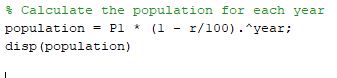
% Calculate the population for each year
population = P1 * (1 – r/100).^year;
disp(population)
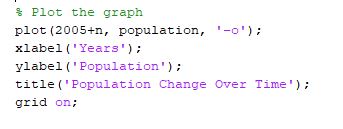
% Plot the graph
plot(2005+n, population, ‘-o’);
xlabel(‘Years’);
ylabel(‘Population’);
title(‘Population Change Over Time’);
grid on;
The Matlab Code interpretation
- P1 = 50000;: This line initializes the variable P1 with the initial population value of 50,000.
- r = 15;: This line initializes the variable r with the decay rate of 15% per year.
- year = 0:6;: This line creates a vector year representing the time period of six years from 0 to 6.
- population = P1 * (1 – r/100).^year;: This line calculates the population for each year using the exponential decay formula. It applies the decay rate to each year using element-wise exponentiation.
- disp(population): This line displays the calculated population values for each year in the command window.
- plot(2005 + year, population, ‘-o’);: This line plots the graph of population change over time. The x-axis represents the years, and the y-axis represents the population. 2005 + year is used to offset the x-axis to represent the years starting from 2005.
- xlabel(‘Years’);: Sets the label for the x-axis to ‘Years’.
- ylabel(‘Population’);: Sets the label for the y-axis to ‘Population’.
- title(‘Population Change Over Time’);: Sets the title of the plot to ‘Population Change Over Time’.
- grid on;: Displays the grid on the plot for better readability.
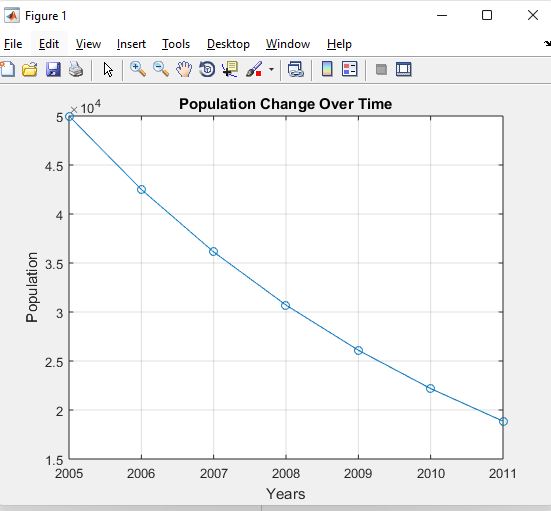
The resulting graph will illustrate how the population changes over the period of six years, starting from the year 2005. The decay rate is applied to the initial population, and the graph shows a decreasing trend over time. The -o in plot adds markers to the graph to indicate each data point.
Uniuyo CSC Matlab practical 5 problem interpretation
The MATLAB code provided simulates and visualizes the change in population over a six-year period, starting from the year 2005, assuming a decay rate of 15% per year. Let’s interpret the result:
- Initial Population (2005):
- The initial population in 2005 is given as 50,000 (specified by
P1 = 50000).
- The initial population in 2005 is given as 50,000 (specified by
- Decay Rate:
- The decay rate is set to 15% per year (
r = 15), indicating that the population is decreasing by 15% each year.
- The decay rate is set to 15% per year (
- Population Calculation:
- The code calculates the population for each year using the exponential decay formula: Population=P1×(1−r/100)^year
- The resulting population values for each year are displayed in the command window (
disp(population)).
- Graphical Representation:
- The script then plots a graph illustrating the population change over time.
- The x-axis represents the years, starting from 2005 (
plot(2005 + year, population, '-o')). - The y-axis represents the population.
- The graph shows how the population decreases over the six-year period.
- Interpretation:
- The Matlab graph demonstrates an exponential decay pattern, where the population decreases rapidly initially and slows down over time.
- The negative slope of the curve indicates a declining population trend.
- The markers (
-o) on the graph represent the population values for each corresponding year.
- Conclusion:
- The interpretation suggests that, based on the given parameters, the city’s population experiences a continuous decline over the specified six-year period, with the rate of decline determined by the 15% annual decay rate.
An Inference
- Population Decline:
- The population of the city has been declining steadily over the six-year period from 2005 to 2010.
- The exponential decay model with a 15% annual decay rate suggests a continuous decrease in population.
- Rate of Decline:
- The rate of population decline is relatively high initially, as shown by the steep slope of the graph.
- Over time, the rate of decline gradually slows down, indicating a diminishing impact of the annual 15% decay rate.
- Population Projection:
- If the current trend continues, the population is expected to continue decreasing in the coming years.
- However, the rate of decline is not as severe in later years, suggesting that the population might approach a stable value.
Disclaimer: Academic Integrity
This Matlab educational content is provided for learning purposes and is intended to supplement your studies. The materials presented on this site, including but not limited to text, images, and code samples, are the intellectual property of [webzalo ].
Do not copy during exams or tests: It is strictly prohibited to reproduce or copy any content from this site during examinations, tests, or any other academic assessments. Plagiarism is a serious violation of academic integrity and ethical standards.
Encouragement of independent learning: We encourage students to use this material as a learning resource to enhance their understanding of the subjects covered. It is important to engage with the content, ask questions, and apply the knowledge gained independently.
Respect for academic rules: We expect all users of this site to adhere to their educational institution’s rules and regulations regarding academic integrity. The site owner, administrators, and contributors are not responsible for any consequences resulting from a breach of these rules.
By accessing and using this site, you acknowledge that you have read, understood, and agreed to abide by the terms outlined in this disclaimer.
Assist yourself financially by going through platforms that can get you some reasonable amount of cash at bensfola reviews. Also read articles on scholarship and scholarship related articles on webzalo scholarship